DISCUSSION
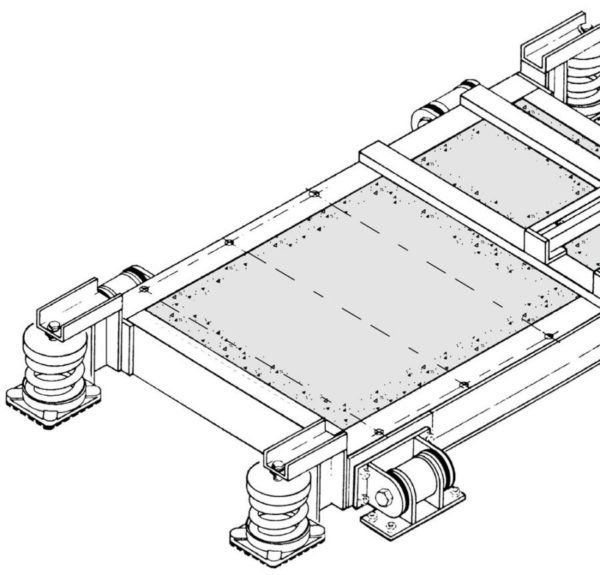
The very term ‘vibration isolation’ suggests the use of resilient materials between a structure and a machine. The classic model is a mass on top of large coil springs located near the four corners, as in Figure 1. While this is a perfectly practical system for vibration control, when dealing with earthquakes we must now visualize what would happen to the mass when we move the floor horizontally and vertically in random directions through a range of frequencies. If the floor frequency was very high in relation to the spring system, the mass would be isolated and remain motionless in space as in Figure 2. If the floor frequency was very low, the mass would move with the structure as in Figure 3. During most seismic events, however, the range of input frequencies includes the system’s resonance so that the springs act as amplifiers with the mass developing enough motion to damage or fly free of the springs as in Figure 4. When we go from the theoretical to the practical, the mass may really be equipment mounted on a concrete block which is in turn mounted on the springs or equipment mounted on the isolators. In either case the accelerations may result in g forces that are high enough to damage or destroy as illustrated in Figure 5.
This problem has been recognized for quite some time, but until very recently the criteria for the restraint of these machines generally came from the uniform building code. Specifications were based on the architectural standards and applied to the machinery within the building. They might call out some vertical and horizontal static restraining capability in the order of 0.1 to 0.2 g. This requirement could be met by providing angle bumpers around the machine foundations as in Figure 6 or using through bolts in arrangements similar to our SLR mounting, Figure 7. The standards have been upgraded more recently and some requirements are now as high as 2 g. Unfortunately, even a 2 g restraint, designed statically, may be inadequate in terms of what really happens during an earthquake.
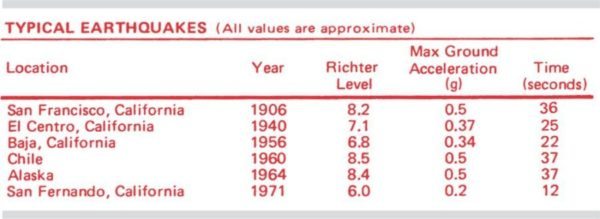
In February of 1971, the dramatic results of the San Fernando quake in California made every architect and engineer aware of the tremendous damage that could be done by seismic forces that were relatively small in magnitude and intensity and in keeping with the mood of the period, the San Francisco chapter of ASHRAE asked us to look into the problem and to present a program on control of resiliently mounted equipment and piping during an earthquake. Faced with this responsibility, we spent many months studying data provided by the 1971 quake and we were amazed by the fact that this quake had ground accelerations of only 0.2 g lasting 12 seconds and puzzled by the photographs of sheared anchor bolts, thrown motors, overturned transformers, displaced chillers, broken spring mountings and pretzel-like piping. It was evident that the static approach to the problem was completely inadequate as some of the bolts that failed must have seen forces as large as 10 or 20 g or no damage would have occurred.


Equipment rigidly attached to foundations at grade broke free in some cases and didn’t in others, even though the bolting arrangements and configurations of the equipment were quite similar. Since the forces at ground level were so low, what was the difference in the two installations? In one case the bolts must have been tight fitting so no looseness occurred and in the other situation there must have been sloppiness in the attachments so that rather than a problem in statics, we now had a machine in motion and the problem of kinetic energy. Once these large masses slammed into the anchor bolts we were dealing with an impact problem and the attempt to instantly decelerate the moving mass resulted in g forces large enough to shear the bolts as in Figure 8.
We also concluded that in those cases where there was tensile failure or uprooting of the foundation bolts as in Figure 9 it was because the center of gravity of the equipment was high relative to the width of the base and the minor rocking resulted in large rotational forces. During this phase of our study we were unaware of anchored equipment resonance and resultant force amplification as another possible explanation for the damage.
LOCKOUT DEVICES
Isolated equipment must be mounted on resilient supports and the more flexible the isolator, the more difficult it is to visualize the equipment moving in phase with the support motion. One way to force it to do so would be to resort to earthquake actuated lockout devices. While this is a possible solution to the problem, it would appear that such devices might be costly and unless they literally froze the equipment to the structure there would be the same danger of tearing free as in the case of poorly secured equipment without isolation. There would always be the question as when to activate the devices and the added difficulty of the maintaining and policing such a system as there are long intervals between quakes. The average maintenance department is burdened with keeping the operating portion of a plant at peak efficiency and it would be optimistic to expect them to continue inspection procedures on earthquake lockouts with the regularity required to make these systems reliable in hundreds or even thousands of locations.
SNUBBERS
Because of these factors it appeared to be far more practical to retain the active isolation system and to come up with some passive, maintenance-free, system of resilient snubbers with a practical clearance or air gap between the equipment and the stops so they would be out of contact during normal operation. There would have to be a sufficient thickness of the absorption material to decelerate the machinery slowly when the motions caused by the seismic event exceeded the air gap and the rate of this deceleration would determine both the amplitudes and the output forces seen by the machine. Figure 10 is a schematic arrangement of these requirements.
Our first approach to this problem was based on the work we did during the missile crisis when mountings were designed to take a major shock impulse from the earth and reduce its force so that on the output end the equipment would see only 3 g. During that era there was common agreement that most mechanical equipment could take 3 g and remain operative.
Investigation into today’s shipping standards showed that normal shipment by truck or train subjects mechanical equipment to 5 g and that, on occasion, levels even approach 10 g. Therefore, it seemed that a good working level for the snubber output might be 4 g and we were able to set up the following design parameters.
DESIGN PARAMETERS
1. The snubbers should be all-directional as there would be no predicting the direction of the resultant forces. All-directional snubbers would distribute the loads over 4 rather than 2 locations, which would make both the anchoring and equipment attachment problems less difficult.
2. The contact surfaces would have to be resilient, have a predictable stiffness and be sufficiently thick so as to allow adequate time for deceleration in order
to keep the forces down to the 4 g level.
3. A minimum air gap of 1/8” to 1/4” would allow for:
a. errors in alignment
b. minor shifting
c. hole location tolerances
d. elevation tolerances
4. Clearances should be factory set and located to maintain centering during installation. A simple release mechanism should be included to release the snubbers after positioning and attachment to both the equipment and the structure.
5. The snubbers would have to be structurally sound and the general design
would have to lend itself to simple analysis.
6. The snubbers would have to be designed for simple attachment to bases, equipment and the supporting structure.
7. The design would have to be economically feasible.
Z-1011 SNUBBER
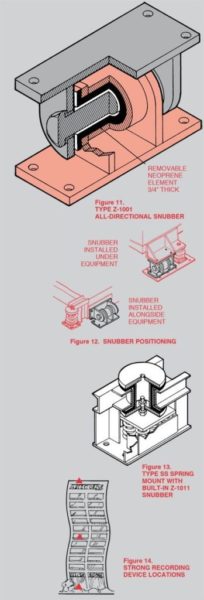
In 1972 we came up with the Z-1011 concept as illustrated in Figure 11. This design could be made in any size range and the structural elements consisting of pins, tubes and plates could be analyzed as required. The hardness, thickness, length and diameter of the snubbing material added infinite variation to the design and the control of the air gap was a simple matter of varying the diameter of the pin versus the ID of the neoprene bushing. End clearances were similarly controllable. The snubbers could be attached above, below or on the sides of equipment and the structure adapted for attachment to piping as well, as seen in Figure 12. This 1972 arrangement of materials continues to be our standard. There is a whole family of Z-1011 snubbers as required, depending on input conditions and the number of pounds assigned to each snubbing point.
In some applications it is more convenient to build the Z-1011 right into the top of the spring mounting as shown in Figure 13. When this is done, all of the same design considerations apply to the upper snubbing element. The snubbing material is made of bridge bearing neoprene or another elastomer of similar physical and aging characteristics to guarantee performance for the life of the installation. This element is removable and can be checked after a quake and replaced if physically damaged.
RESPONSE SPECTRUM
Since we were dealing with a dynamic rather than a static problem, we started to study Z-1011 stiffness requirements using velocity equations based on the information provided by the strong recording devices installed in the buildings affected by the San Fernando quake. There is a considerable amount of data available as these devices must be installed at ground level at the mid-point and at the top of all major California structures as shown in Figure 14. Even though we studied a mode at a time we found that the problem was extremely complex as an earthquake is not a single jolt, but an input of random frequencies at different acceleration levels, all of which may have some effect on the isolation system and set it into motion. It was at this time we became aware of the fact that these effects are best expressed by the “Response Spectrum” shown in Figure 15. The Response Spectrum tells us that the forces experienced by different objects during the same earthquake are not just a function of the quake, but the “response” to this quake. This response depends on the natural frequency or resonance of the object being studied. A great deal of single mode information can be read directly from the chart.
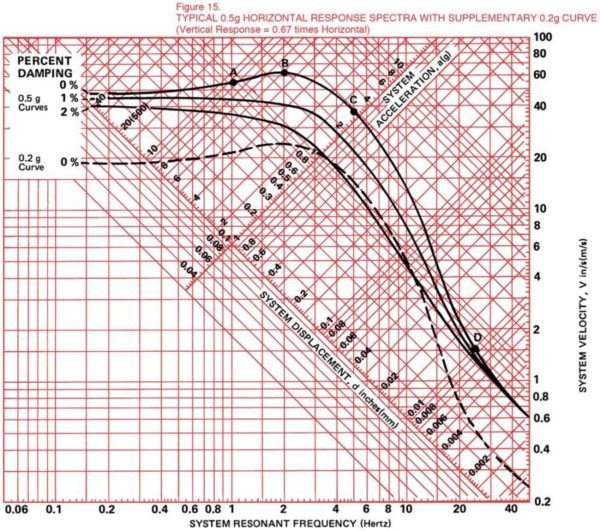
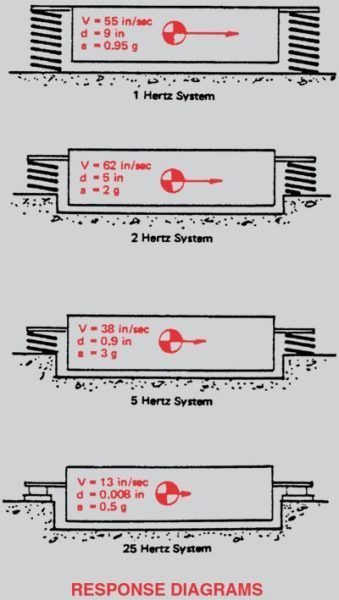
The horizontal axis of the Response Spectrum expresses the resonance or natural frequency of the object effected by the quake. The vertical axis shows the velocity attained by this object during the quake. The diagonal axis running up toward the right-hand corner reads the maximum accelerations to which the object is subjected. The axis at right angles to this will read the displacement of the object in relation to the support. Superimposed on these scales are the Response Curves and while these are normally drawn for damping values as high as 10, we have only shown three curves indicating 0, 1 and 2% of critical damping as higher levels are most unusual. This particular curve is referred to as a 0.5 g level at the high frequency limits. Now let us see how various objects might act during an earthquake described by these curves and let’s use 0 damping as our reference.
If the object to be studied had a natural frequency of 1 Hertz we would start at the bottom of the chart and reference vertically until we intersected the response curve. From this intersection, Point A, we travel to the extreme right and read a velocity of 55” per second. By following a displacement line diagonally down to the left we find a displacement of 9”. By following an acceleration line down to the right we see that it will experience an acceleration of 0.9g. If we then move to the 2 Hertz frequency, Point B, in the same sequence, we find that we will have a maximum velocity of approximately 62” per second, a displacement of 5” and a maximum acceleration of 2 g. If we then move to 5 Hertz, Point C, we see a velocity of 38” per second, a displacement of 1.2” and an acceleration of 3 g. If we run all the way out to 2 Hertz, Point D, we find that we are in to the asymptotic area with a velocity of .5” per second, a displacement of 0.01” and an acceleration of 0.6 g. Notice that the values vary widely, as stated earlier, depending on the natural frequency of the object exposed to this particular quake.
An approximation of the response to a 0.2 g earthquake at ground level can be attained by retaining the shape of the curves and moving them down on the chart to the 0.2 g acceleration line and repeating the procedure. We have dotted in such a curve for 0 damping in illustration of the above.
As the natural or response frequency of a system is established by the resilient mountings we would look at the amplitudes to find out whether we could stand the motion. In practically every example cited above the motions would be excessive and the machine would fly off the springs. This is no longer the case at 25 Hertz, but in all the other examples it would have been necessary to use snubbers to control the motion. The stiffer 25 Hertz mount is normally used as a last resort as it is a poor vibration isolator.
Figure 15 is a ground level Response Spectra. When considering the placement of machinery higher in the structure it is important to obtain a proper Response Spectra for the machinery locations (typically Figure 17) as the seismic design would be dependent on that particular input and not what happens at ground level.
MASON INDUSTRIES’ Z-1011
NON-LINEAR SEISMIC RESPONSE COMPUTER PROGRAM
For RESILIENTLY MOUNTED EQUIPMENT
DEVELOPMENT
When we realized that a correct design would depend on a scanning of the complete earthquake input spectrum and that this must be done in the vertical and two horizontal modes as well as in the three rocking modes, it became apparent that we were in the area best served by the computer and that we did not have the inhouse capability to develop a proper program.
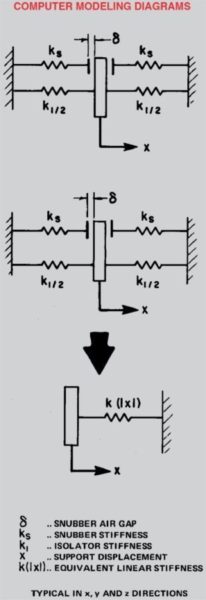
Therefore, we took our concept to Dr. Wilfred Iwan, who is a member of the faculty of the Department of Earthquake Engineering at Caltech in Pasadena, California. We explained our problem and asked if it would be possible to develop a program that would provide the complete analysis. Dr. Iwan undertook the study and after a year of development we now have the capability of modeling a machinery installation in terms as many as twenty-six individual components, and describing their configurations in terms of circles, squares or triangles. We can place this configuration on a spring system as specified for vibration control and feed in the earthquake response spectra. The computer responds with the natural frequencies in all six modes and lets us know what the maximum motions and accelerations are at any of the twenty-six points in the system. These are usually the mounting locations, equipment centers of gravity, extreme configuration points and mechanical connection locations. If for some reason the system contains more than twenty-six important points this additional information can be developed as well and it merely means that multiple runs must be made as determined by the total number of points divided by twenty-six. Figure 1 depicts the equipment and the mathematical model drawing.
If the amplitudes are excessive we advise the computer that we are installing snubbers. Normally four snubbers are used and we tell the computer where they are located, the size of the air gap as well as the spring rate of the snubbing materials. The computer then lets us know the new amplitudes and the new g forces in all of the pertinent locations. If these forces are too large, or the excursions remain too great, it is then a matter of offering the computer another snubber design until we reach some satisfactory optimum condition.
Figure 17 shows us an example of the shape of an upper story response curve. In some cases, especially those where the specified isolator frequency for isolation purposes happens to fall in the maximum response area on the response curve, there is no practical solution with the snubber system and it becomes necessary to first select a vibration isolator of some other frequency and offer this as a possible alternate to the specifying engineer. Where even this can’t be done you can go on to a completely captive 25 Hertz isolator as shown in Figure 18. Twenty-five Hertz isolators merely provide sound and virtually no vibration isolation, but they are the only practical solution to some earthquake problems. Fortunately, in most cases, this solution is only necessary at ground elevations. It becomes apparent then, that rather than describing a seismic isolation system in terms of capability, that in reality, it must be described in dynamic terms.

TECHNICAL DESCRIPTION of Z-1011 COMPUTER PROGRAM
Modeling Assumptions
Equipment is modeled as a single, three-dimensional rigid body composed of several rigidly attached lumped masses. Each support is modeled as a combination of linear springs as shown in Sketch A. With these assumptions, the system is conservative and has six natural modes and frequencies.
Method of Analysis
An approximate solution is obtained employing a response spectrum technique. The final solution is obtained as a combination of modal responses in the form of a “most probable” value (rms of six modes ) and an “upperbound” value (sum of absolute values of six modes).
The solution technique is motivated by the following 3 properties of linear systems:
1. Rayleigh’s principle, which for conservative systems states that in any mode,
maximum kinetic energy equals maximum potential energy.
2. The earthquake response spectrum which yields the maximum kinetic energy
as a function of natural frequency.
These principles are applied to the nonlinear snubber-isolator system by the assumption that:
3. At each support, the nonlinear snubber-isolator spring combination may be
replaced by a single equivalent linear spring which is dependent on the
displacement amplitudes, as depicted in Sketch B.
Thus, (1) and (2) yield displacement amplitude as a function of natural frequencies, and (3) yields natural frequencies as a function of displacement amplitude.
This transcendental relationship is solved by an iterative procedure as follows: from the non-snubbed natural frequencies, the modal kinetic energies are determined using the response spectrum. By equating kinetic and potential energies, the nonlinear displacement amplitudes are obtained numerically. From these displacements, a new estimate of effective natural frequency is obtained using the equivalent linear support stiffness. The procedure is continued until the natural frequencies converge.
Our interactive computer program utilizing the above solution technique runs on a PDP-10 time-sharing system. The program provides estimates of maximum response, displacement and acceleration at any location of the system. In particular, the program provides direct read-out of maximum displacement and force load at each equipment component as well as any remote connection. The program can simultaneously accept three different sets of response data (one for each mode) if required.
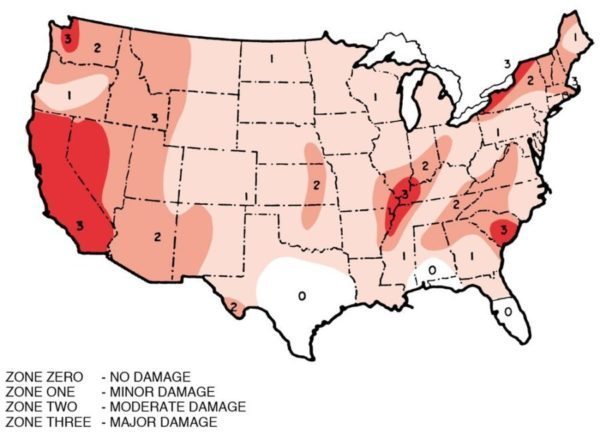
Figure 19.
UNITED STATES SEISMIC ZONE MAP
(From the Uniform Building Code)
All of the Unite States, including Hawaii and Alaska, have been zoned off in terms of earthquake probability as shown in Figure 19. The zones on these maps are described numerically from zero through three. Zone Zero is an area where no damage results from earthquake; Zone One, minor damage; Zone Two, moderate damage; and Zone Three, major damage. Thus, in all of the zones other than zero, it becomes apparent that there should be some seismic provisions and while the Response Spectra would have much lower values in Zone One than in Zone Three, the basic approach to the problem remains the same. It is interesting to note how small an area of the country is actually Zone Zero.
INSTALLATION PRECAUTIONS
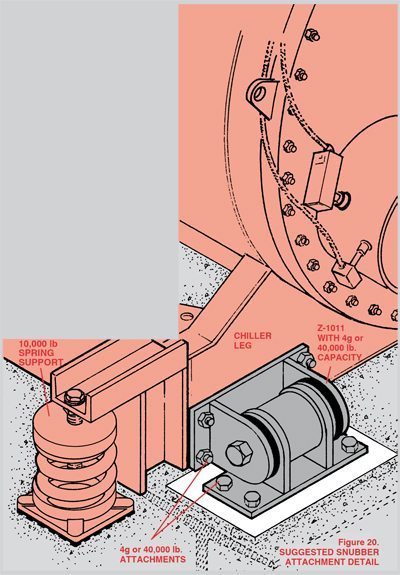
The application of these snubbing systems can only be as successful as the strength of the attachment points. Thus, a successful installation will require extreme cooperation between the architect, the structural engineer, the equipment manufacturer and the vibration control vendor. It is important to remember that when snubbers develop 4 g the equipment and structural attachment points as well as the equipment and the structure itself must all be able to withstand these same forces.
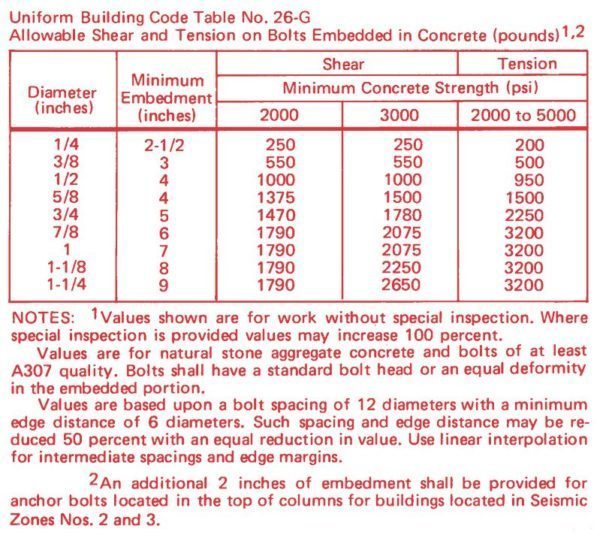
If we are dealing with a hundred pound snubber location, the anchors need only develop 400 pounds in all modes. By the same token, at a 10,000 pound chiller leg location the anchoring must be capable of handling 40,000 pounds. In some cases, this might require the imbedding of steel plates in the structure, with these steel plates welded to the structural beams, the snubbers welded to the plates and welded or bolted to the equipment as well (Figure 20). Anchor bolts embedded in concrete shall conform to UBC Table 26-G.
Since the equipment manufacturer is often unknown until after the contract is awarded the structural people may find it necessary to leave final locations of beams open until such time as vibration submittals are complete. In other cases, the mechanical consultant may find it necessary to limit acceptability to only a few equipment manufacturers so as to put some limitations on the physical dimensions and weight of the equipment. In this way the structural people can come closer to a final design before the award of contracts.
SEISMIC SPECIFICATION DISCUSSION
The writing of seismic specifications for equipment in facilities such as nuclear power plants is extremely definitive whether the equipment is on vibration isolators or anchored to the structure. It must be so, as the failure or shutdown of some of the equipment might actually result in a nuclear catastrophic. The nuclear specifications require the machinery vendor to submit detailed calculations or to follow a test procedure demonstrating that each component can actually withstand whatever output forces develop and in many cases this analysis is almost as expensive as the equipment itself. Mountings and snubbers for these application must be manufactured under Quality Assurance (QA) programs.
In our own specification we are not going to these lengths as we feel nuclear standards might be needlessly expensive for applications in commercial buildings. Our suggestion is that in commercial structures, if the equipment arrives on the job after normal transport and is operative upon installation it has already demonstrated a 4 g capability and that this is its true minimum fragility level with no further calculations required. Where the consultant does not share this view and where captivity during the quake is of prime concern, we would suggest that analysis be limited to captive failure points such as the breaking off of legs, etc. More detailed analysis of the equipment can be called for where the equipment might be life supporting.
At this writing we tend to believe that our commercial Response Spectra Specification is conservative enough for nuclear applications as well, with the added notations that snubbers must be manufactured under a QA program and that no critical equipment component shall have a resonant frequency in the range of any of the isolation system’s snubber adjusted frequencies, either divided or multiplied by 1.4 or that all critical components have a resonant frequency of 30 Hertz or over. We feel this is valid as the computer program will be reporting a maximum output of 4 g (transport fragility) assuming lumped masses and we need only be concerned with further amplifications at the mounting system frequencies. The study is too new however to make this commitment without additional experience and exposure to typical curves and equipment resonances.
Specification I is suggested for those buildings where seismic response curves are available for all levels. This is usually the case for major buildings in Zone Three. Specification II is included for more modest structures where this design data is not available and for possible application to large structures in Zone One and Two. Specification II is a definite improvement on the present static approach to the problem and would certainly represent a best efforts basis on the part of the consultant. A mechanical consultant has the additional option of using Specification I and providing typical response curves as suggested by a seismic authority rather than specific response curves calculated for that particular building. The seismic specifications are supplementary to the vibration control specification provided in our publication VCS-100.
MASON INDUSTRIES’ Z-1011 SEISMIC SNUBBING SPECIFICATIONS
SPECIFICATION I – SEISMIC SNUBBER SPECIFICATION USING RESPONSE SPECTRUM DATA
All vibration isolated equipment shall be mounted on rigid steel frames or concrete bases as described in the vibration control specifications unless the equipment manufacturer certifies direct attachment capability. Each spring mounted base shall have a minimum of four all-directional seismic snubbers that are double acting and located as close to the vibration isolators as possible to facilitate attachment both to the base and the structure. The snubbers shall consist of interlocking steel members restrained by shock absorbent rubber materials compounded to Bridge Bearing Specifications as tabulated below. Elastomeric materials shall be replaceable and a minimum of 3/4” thick. A minimum air gap of 1/8” shall be incorporated in the snubber design in all directions before contact is made between the rigid and resilient surfaces. Snubbers shall be installed with factory set clearances. Submittals shall include load deflection curves up to 1/2” deflection in the x, y and z planes. Tests shall be conducted in an independent laboratory or under the signed supervision of an independent registered engineer. The snubber assemblies shall be bolted to the test machine as the snubber is normally installed. Test reports shall certify that neither the neoprene elements nor the snubber body sustained any obvious deformation after release of load.

The selection of the particular seismic snubber shall be based upon a complete dynamic analysis furnished by the vendor and based on the seismic response data.
The computer report shall include the following information along the X, Y and Z axis.
a. The six natural frequencies of the system both with and without snubbing.
b. The most probable movements (RMS values) at all mounting or combination mounting and snubber locations as well as remote source points such as duct, pipe and electrical connections and the machine extremities.
c. Maximum accelerations at the center of each significant system element such as the motor, fan, compressor, heat exchanger, or pumps as well as mounting or combination mountings and snubber locations, all expressed in g units.
d. The most probable force (RMS value) at each mounting or mounting and snubber location expressed in pounds.
It is the intent of the specification that the acceleration shall not exceed 4 g nor the excursion from center, 5/8” at the snubbers.
When the analysis shows that levels higher than 4 g occur at the snubbers because of the maximum allowable amplitude, the vendor shall suggest an alternate mount system based upon an additional dynamic analysis that will maintain the 4 g level. Either the higher g level or the alternate method shall be accepted at the option of the consultant.
The analysis shall be the readout of a computer program with equipment modeled as a single three dimension rigid body composed of several rigidly attached lumped masses. For the purpose of the analysis at each support, the non-linear snubber-isolator spring combination may be replaced by a single equivalent linear spring which is dependent on the displacement amplitude. The system must be conservative and have six natural modes and frequencies.
The final solution shall be obtained as a combination of modal responses in the form of a ‘most probable’ value (RMS of 6 modes) and an ‘upperbound’ value ‘sum of absolute values of 6 modes’.
The snubbing system shall be Mason Industries, Incorporated, series Z-1011 and all reports based on a computer program as described above.
SPECIFICATION II – SEISMIC SNUBBER SPECIFICATION WITHOUT RESPONSE SPECTRUM DATA
All vibration isolated equipment shall be mounted on rigid steel frames or concrete bases as described in the vibration control specifications unless the equipment manufacturer certifies direct attachment capability. Each spring mounted base shall have a minimum of four all-directional seismic snubbers that are double acting and located as close to the vibration isolators as possible to facilitate attachment both to the base and the structure. The snubbers shall consist of interlocking steel members restrained by shock absorbent rubber materials compounded to Bridge Bearing Specifications as tabulated below.

Elastomeric materials shall be replaceable and a minimum of 3/4” thick. Snubbers shall be manufactured with an air gap between hard and resilient material of not less than 1/8” nor more than 1/4”. Snubbers shall be installed with factory set clearances.
The capacity of the seismic snubber at 3/8” deflection shall be 3 or 4 times the load assigned to the mount grouping in its immediate area. Submittals shall include load deflection curves up to 1/2” deflection in the x, y and z planes. Tests shall be conducted in an independent laboratory or under the signed supervision of an independent registered engineer. The snubber assemblies shall be bolted to the test machine as the snubber is normally installed. Test reports shall certify that neither the neoprene elements nor the snubber body sustained any obvious deformation after release of load. Snubbers shall be series Z-1011 as manufactured by Mason Industries, Inc.
